A customer health score is one number per customer that tells you how likely they are to renew — and how worried you should be if they’re not. The score is built from several inputs combined: how much they use the product, how many support tickets they open, whether their bills get paid on time, and the tone of recent conversations with your team.
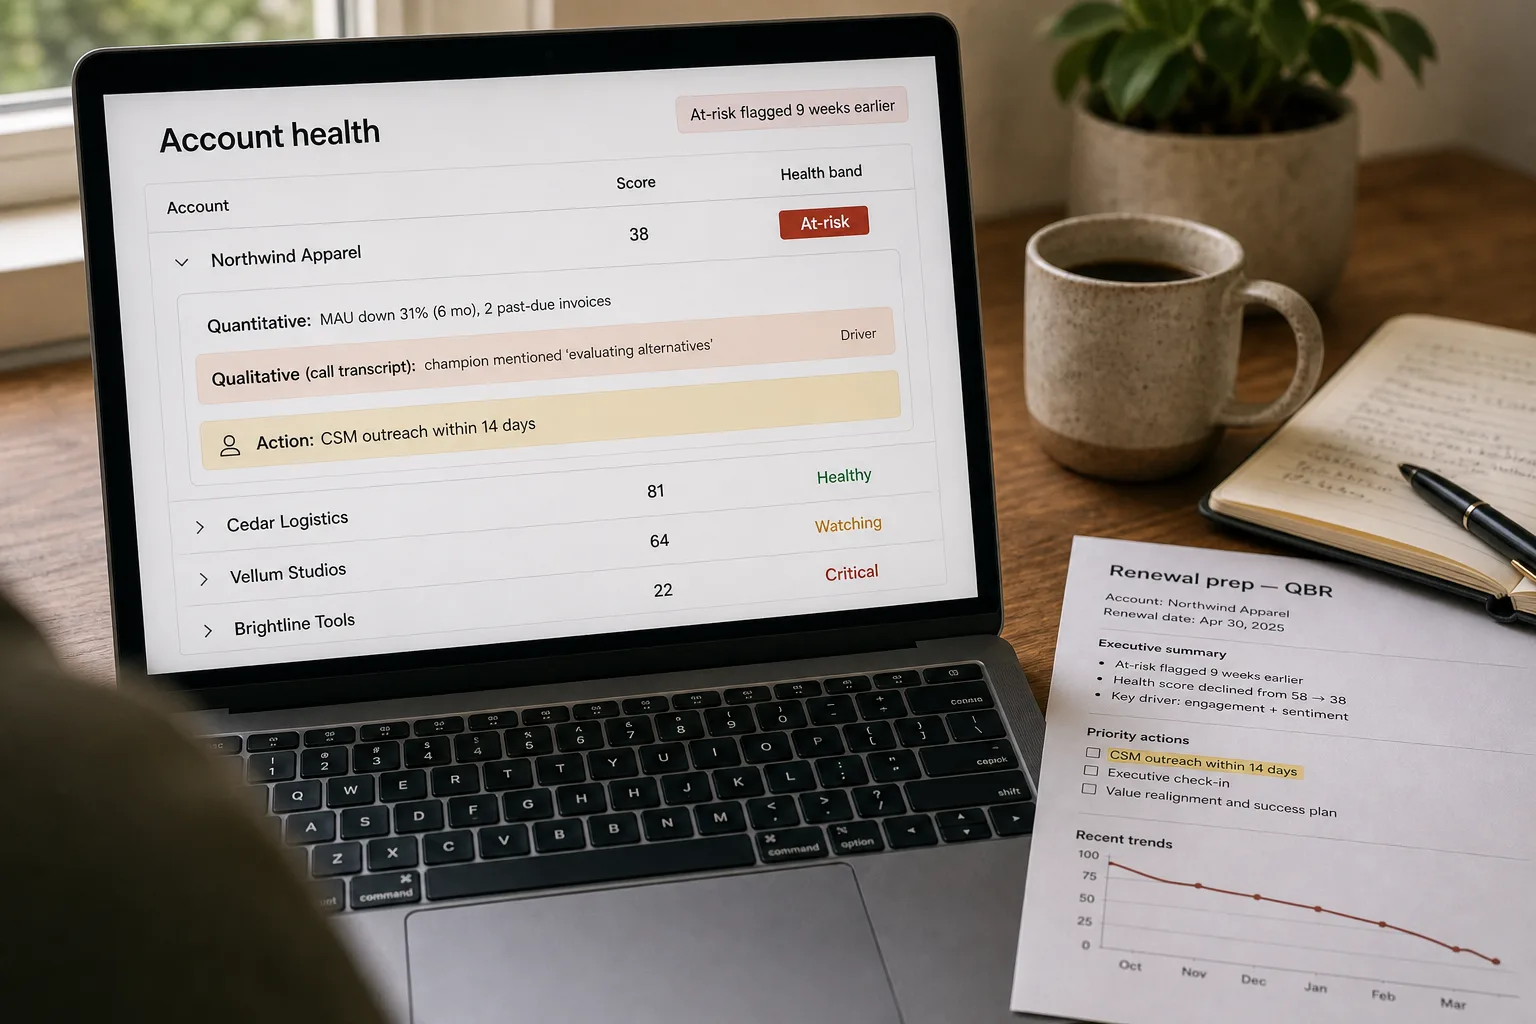
The customer who eventually cancels rarely surprises the customer success team in retrospect. The signals were there: monthly active users dropped six months ago, the champion stopped responding to QBR requests in March, two support tickets had a frustrated tone in April, and the renewal questionnaire came back with one-word answers in May. Each signal alone was inconclusive. The combination was the story. The health score’s job is to surface that combination weeks earlier than human attention does — while the relationship can still be repaired.
The score has two halves. The numeric half — product usage, billing, support volume — is straightforward data-warehouse work. The qualitative half is where AI earns its keep: extracting sentiment and intent from the conversations that CRM dashboards reduce to “last contacted on date X.” This piece is the model that holds up across customer segments, the conversation-extraction layer, and the workflow that turns the score from a vanity metric into renewal motion.
Where this fits — and where it doesn't
Use this if you sell annual contracts (or recurring revenue with notable concentration risk), you have at least 100 active customers, and you have data infrastructure (warehouse, CDP) that can join product usage with support and CRM data. Common fits: B2B SaaS post-product-market-fit, services businesses with retainer-based revenue, marketplace platforms with seller / buyer retention metrics.
Don’t use this if you have very few customers (under 50 — manual relationship management is more reliable than a model), your revenue is overwhelmingly month-to-month (the renewal-motion concept doesn’t apply the same way), or you don’t have CS or account-management capacity to act on the score (a score that nobody acts on is shelfware). For the last case, the score is most useful when there’s a clear motion: outreach, escalation, executive intervention.
What you'll need before starting
- A data warehouse or analytics environment with: product usage data (MAUs, key feature usage, login frequency), support tickets and resolutions, billing / payment events, CRM activity logs (meetings held, emails, deal-stage history), conversation data (call recordings or transcripts if available).
- Identifiers that join across systems — customer ID, account ID, and ideally user IDs that link product activity to billing accounts and CRM records.
- A CS or RevOps operator who can own the score’s interpretation and act on its outputs.
- A model API key for the qualitative-signal extraction. Claude, GPT, or Gemini all handle conversation-content extraction well.
- A clear definition of what “healthy” means for your business. Renewal-rate, expansion-rate, NPS, product-adoption-of-key-features — pick the 2–3 that matter most and define the score in relation to them.
Six steps to a score that drives renewal motion
- Define the score’s purpose — predictive vs descriptive, real-time vs weekly
The score’s design depends on what you’re using it for. Predictive: which customers are likely to churn in the next 90 days? Descriptive: which customers are currently engaged vs disengaged? Real-time: trigger CS action immediately on signal degradation. Weekly: feed into the QBR / renewal-prep workflow. Each shape is different. Most teams want predictive plus weekly; build for that first, then add real-time triggers for the highest-stakes signals.
- Build the quantitative-signal layer — product, billing, support
The base of the score is structured-data signals you already have: product usage trends (week-over-week, month-over-month), feature-adoption depth, support-ticket volume and severity mix, billing health (on-time payments, past-due history), CRM activity (last meaningful contact). These are SQL queries against your warehouse, aggregated to a customer-level rollup. Each signal contributes a sub-score; the composite is a weighted average. Tune weights from churn / expansion outcomes once you have a few months of historical data.
- Add the qualitative-signal layer — sentiment and intent from conversation data
The signals that change the score’s accuracy aren’t in the warehouse — they’re in the conversations. Call transcripts (from sales-call recordings, support calls, CS check-ins), email threads, support tickets with free-text bodies. Run an LLM extraction pass: sentiment per conversation (positive, neutral, negative, escalating), intent signals (“planning to renew”, “evaluating alternatives”, “frustrated with X feature”), and specific risk indicators (“champion is leaving the company”, “merging with another vendor”, “budget cuts mentioned”). Each conversation produces a structured event that joins back to the customer record.
- Combine quantitative and qualitative — the score is the weighted composite
The composite score weights the quantitative signals (typically 60–70% of the score) and the qualitative ones (typically 30–40%). The qualitative signals are spikier — a single negative escalation moves the score sharply, a long pattern of positive interactions raises it gradually. Tune the weights by backtesting against historical outcomes: if the score had been live, would it have predicted the customers who churned? The first few months of tuning are necessary; the score gets meaningfully better after a quarter of real-data feedback.
- Build the action layer — every score change has a routing target
A health score that nobody acts on is shelfware. For each score band (healthy, watching, at-risk, critical), define the operational action: healthy → no action; watching → flag to CSM for awareness; at-risk → CSM outreach within 14 days; critical → manager review, executive sponsor activation, retention motion. The routing should fire automatically — Slack alert, CRM task, Salesforce queue. The score’s value is in driving action; without the action layer, the dashboard is decorative.
- Track score-to-outcome correlation — and retune quarterly
Once the score has been live for 3–6 months, compare predictions against outcomes. Did the customers flagged “at-risk” actually churn or downgrade? Did the customers scored “healthy” renew without incident? The correlation is the model’s accuracy proxy. Tune weights and thresholds quarterly: signals that had little predictive power get downweighted; signals that proved highly predictive get more weight. The score gets meaningfully better over 2–3 quarters of real-data tuning.
What it costs and what to expect
The lead-time number is the operational ROI — earlier identification means more time for retention motion. The renewal-motion impact is the strategic one but varies sharply with how effectively the CS team operates on the signal.
Other ways to solve this
Customer success platforms with built-in scoring (Gainsight, Vitally, ChurnZero, Totango — incorporating Catalyst). Turnkey health-scoring with integrations to common data sources. Right answer for CS organisations at mid-market and enterprise. Trade-off: high per-month cost, scoring logic that’s a black box you can’t fully tune, integration lock-in. Strong fit for teams that want the working system without building.
RevOps-built score in your existing tools. Salesforce, HubSpot, and similar CRMs can build basic health scoring with their own automation. Lower cost; quantitative-only typically; misses the conversation-data layer. Good v0 for smaller teams or when budget for a CS platform isn’t yet justified.
Operator-gut scoring. The traditional approach — the CSM knows which customers are healthy because they talk to them. Works at very small scale (under ~50 customers per CSM); breaks down as portfolios grow. The AI score augments rather than replaces operator judgement; the operator’s qualitative knowledge stays critical even with a tuned model.
Don’t build a score — invest in CSM headcount instead. Sometimes the right answer is more humans, not better signals. CS work is fundamentally relational; a score helps allocate attention but doesn’t replace the relationship. Teams that score-without-CSM-capacity often produce alerts that nobody can act on.
Related work
For the conversation-extraction patterns that power the qualitative layer, see Find patterns in customer feedback. For pulling churn-relevant signals out of support patterns specifically, see Auto-categorize support tickets. For analysing sales-call recordings that feed the score, see Voice transcription for sales calls and customer interviews. For the underlying embedding and classification mechanics, see Embeddings explained without math.
FAQ
How is this different from what Gainsight or Vitally do out of the box?
Functionally similar at the surface level; the difference is in tunability and qualitative depth. Out-of-the-box scoring is configurable for quantitative signals; the qualitative extraction from conversation data is increasingly bundled but varies in depth across platforms. Build a custom score when you want full control over the qualitative pipeline, when your conversation data lives in tools the platforms don't integrate with, or when your data warehouse is the source of truth for the quantitative side. For most SMBs in B2B SaaS, the platforms are the faster path.
What about customers who don't generate much signal — the quiet ones who renew anyway?
Quiet customers are the hardest case. Two patterns. (1) Lower the score's confidence for low-signal customers — explicitly flag them as "insufficient signal" rather than scoring them as healthy by default. (2) Build an explicit "engagement" signal that's a separate sub-score from health; low engagement plus high quantitative signal can still be healthy, but high engagement plus negative quantitative signal is the at-risk pattern. Don't over-fit on customers who provide little data; flag them explicitly for human attention.
How do we handle conversation data that contains confidential customer information?
Enterprise-tier LLM APIs with data exclusion clauses, or self-hosting for highly sensitive industries. See AI privacy — what to watch for for the framework. The qualitative-extraction pipeline only needs to produce structured signals (sentiment, intent, risk flags), not retain the conversation content — design the pipeline to extract and discard, keeping the structured derivative only.
What about expansion signals — customers who are likely to grow?
The same architecture, different signal weights. Expansion signals: feature-adoption depth growing, multi-stakeholder engagement (multiple champions vs single point-of-contact), positive sentiment in expansion-relevant conversations, billing on growth tier. Build a separate "expansion-readiness" score alongside the churn-risk score; they have different operational consequences (CS for retention, sales for expansion) and benefit from being separately tunable.
Can the AI predict churn far enough out to actually act?
Yes for the gradual-churn pattern (3–6 months of declining signals); harder for the sudden-event pattern (acquisition, budget cut, champion departure). The model can flag the gradual decline 4–12 weeks before the cancellation event; the sudden-event churn typically has a 2–4 week warning if any. The realistic positioning is "early enough for retention motion on most churners" not "perfect prediction." Teams that expect the latter are disappointed; teams that frame it as the former see real impact.
How do we know if the score is actually moving the needle on retention?
Hard A/B testing on customer health is operationally difficult — you can't ethically withhold retention motion from a control group. Two proxies. (1) Lead-time analysis: did the score flag at-risk customers earlier than the team would have caught them otherwise? (2) Retention-motion success rate: of customers flagged at-risk and reached by CS, what fraction renewed? Compare to historical baseline before the score existed. Neither is perfect; both produce useful trend signals over a few quarters.