A long-time customer’s renewal date is 90 days away. Over the last two months, the tone of their support tickets has shifted from polite to terse. An escalation last week ended in “we’ll see.” Two tickets about the same unresolved feature gap haven’t gotten anywhere. Each signal alone is inconclusive. Taken together, the trajectory is the story — and it’s the story Customer Success usually doesn’t read until the renewal questionnaire comes back with one-word answers.
This piece is the pipeline that watches the trajectory. Continuous AI analysis across the support corpus, signal extraction at the per-ticket and per-account level, trend detection at the multi-week scale, and an action layer that routes flagged accounts to CS for outreach before the cancellation event. The goal is 60-day lead time — early enough to repair the relationship, late enough that the signal is meaningful.
Where this fits — and where it doesn't
Use this if you have at least 12 months of resolved support history (you need historical churn outcomes to tune against), your CS team can act on 60-day-lead signals (the workflow has to exist downstream), and a meaningful share of churn shows up in support tickets before the renewal conversation. Most B2B SaaS fits this profile. Some categories (consumer apps, low-touch products) don’t have enough support volume per account to generate the signal.
Don’t use this if your customers rarely file support tickets (the signal-generating events don’t exist), your team is already at the scale where Gainsight / Vitally / ChurnZero bundle this analysis (use what you have), or your churn pattern is dominated by external causes (budget cuts, acquisitions) where support signals aren’t predictive.
What you'll need before starting
- A support corpus that joins to account IDs in your CRM — Zendesk, Intercom, Front, Help Scout all expose this via API.
- Historical churn outcomes you can backtest against — which accounts churned in the last 12 months, when, and why where known.
- A data warehouse or analytics environment to aggregate signals per account over time. Building this on raw helpdesk data without a warehouse is painful.
- A model API key for sentiment and pattern extraction. Cheap-tier models suffice; you’re running classification at volume, not deep reasoning.
- A CS team or RevOps operator who will own the flag workflow. The signal is only valuable if someone acts on it.
Six steps to a churn signal that's actually predictive
- Define what counts as a churn-predictive signal — beyond ticket count
Ticket count alone is a weak signal — many healthy customers file lots of tickets, and some churning customers go quiet. The richer signals are: tone trajectory (sentiment trending negative over weeks), escalation rate (percentage of tickets that hit manager or executive review), topic-clustering (recurring questions about the same unresolved issue), explicit churn language (mentions of “evaluating alternatives”, “may not renew”, “looking for other options”), and response-time-to-customer-message increasing on the customer side (they’re disengaging).
- Extract signals per ticket with structured output
For each new and historical ticket, run an LLM extraction: sentiment (positive / neutral / negative / escalating), specific churn-indicator phrases (with verbatim quotes), topic cluster (mapped to your product areas), and customer-effort score (how much friction the customer is experiencing). Cheap-tier models handle this; the extraction is structured and small per ticket. Store the structured output joined to the ticket and account.
- Aggregate signals to the account level over rolling windows
The per-ticket signals roll up to per-account trends: 30-day rolling sentiment, escalation rate over 60 days, topic-cluster diversity (concentrated on one unresolved problem vs spread across normal usage), churn-language mentions per quarter. The rolling windows matter — a single negative ticket is noise; a 60-day trajectory toward negative sentiment is signal. Don’t alert on point events; alert on trajectories.
- Backtest against historical churn — tune the threshold weights
With 12 months of historical churn outcomes, run the signal pipeline retroactively and see which signal combinations would have predicted the actual churners. Tune weights: signals that correlated with churn get upweighted; signals that fired equally on healthy and churning accounts get downweighted. The backtest is what makes the system predictive rather than descriptive; without it, you’re guessing at thresholds.
- Route flagged accounts to CS with the signal-evidence attached
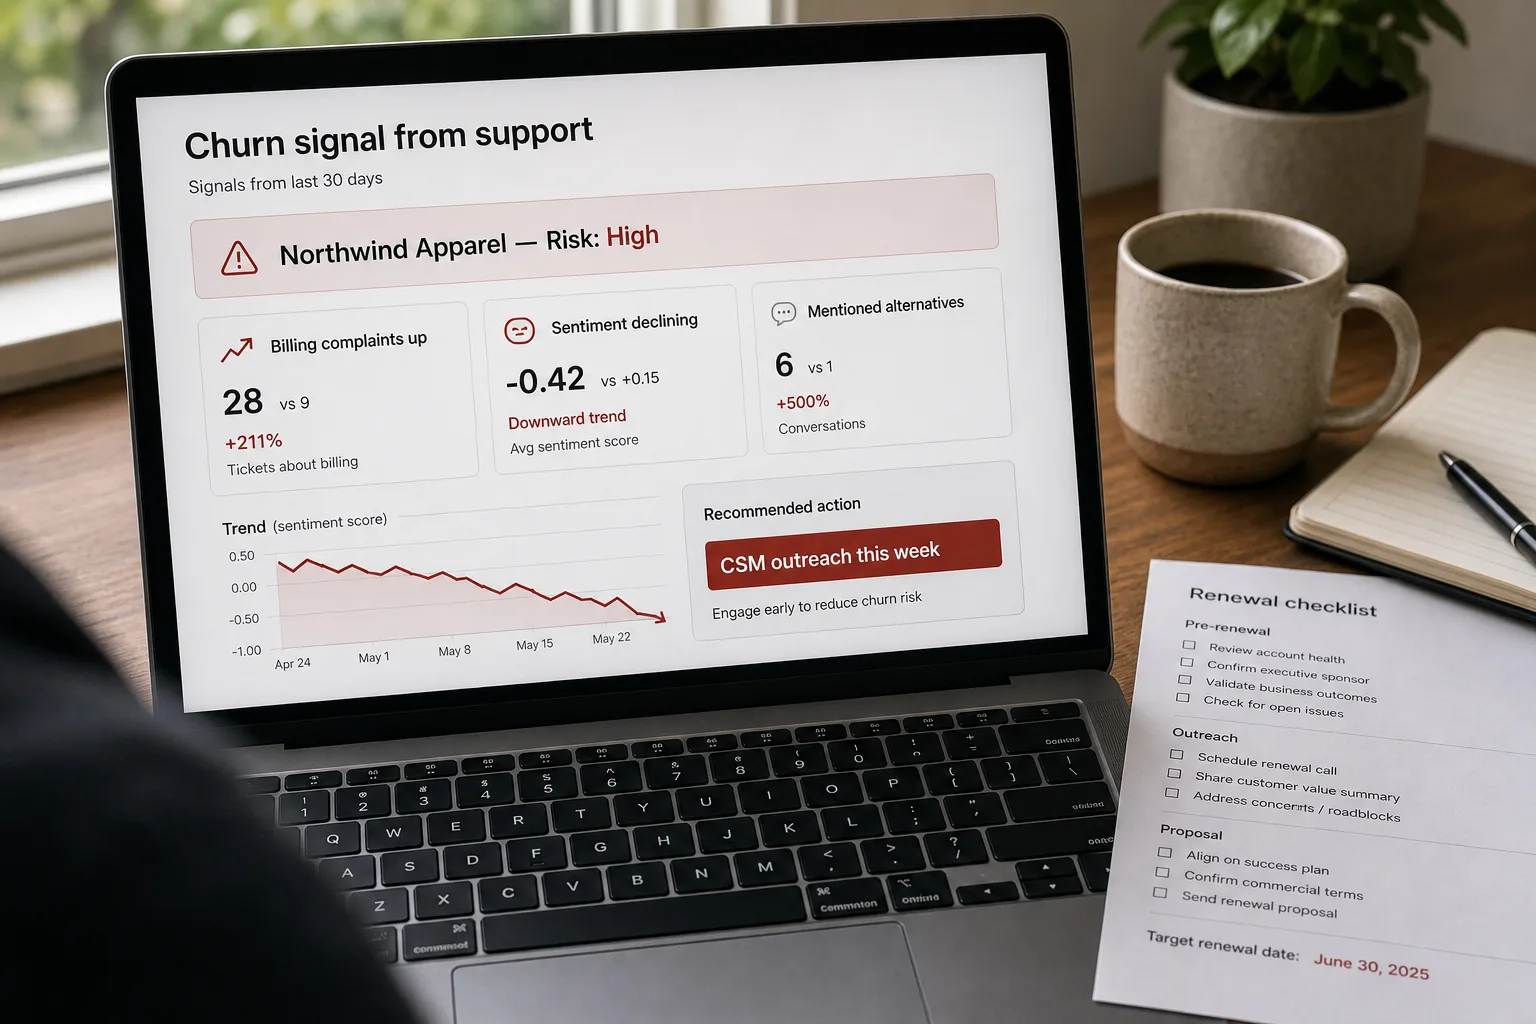
When an account crosses the alert threshold, route to CS with: the specific signals that fired, the verbatim ticket quotes that anchor them, the rolling-trend chart, and the recommended motion (proactive outreach, executive sponsor activation, account-team review). The evidence-attached routing prevents the “what do I do with this?” question — CS gets enough context to take the call immediately. Without the evidence, the flag is noise.
- Track outcomes — flagged accounts that were saved vs lost
For each flagged account, log the eventual outcome: renewed normally, downgraded, churned. Compare against the unflagged baseline to measure the pipeline’s predictive value and CS’s intervention effectiveness. After 2–3 quarters, the data tells you which signal combinations predict best and which intervention motions actually save accounts. Both feed back into the pipeline: signals get retuned, motions get refined.
What it costs and what to expect
The lead-time number is the operational ROI; the precision-recall pair tells you how trustworthy the signal is for CS action.
Other ways to solve this
Customer Success platforms with bundled churn-risk scoring (Gainsight, Vitally, ChurnZero, Catalyst). Right answer for most CS organisations. Trade-off: cost, opaque scoring logic, integration lock-in.
Composite customer-health score (broader than support). Integrates support patterns with product usage, billing, and CRM activity. See Customer health scoring for the broader pattern; the support-only signal described here is a sub-component of the composite.
Manual at-risk reviews by CS managers. Quarterly portfolio review where CS managers flag at-risk accounts from gut feel. Works at small portfolios; doesn’t scale, misses subtle signals, prone to recency bias. The AI pipeline augments rather than replaces the manager judgement.
Don’t track — react to renewal questionnaires. The default at many companies. Loses the 60-day lead time; produces retention motions during the renewal window when the customer has already made the mental decision.
Related work
For the broader composite health score this signal feeds into, see Customer health scoring from product and support signals. For the upstream support-triage that classifies inbound tickets, see Auto-categorize support tickets. For the broader voice-of-customer aggregation pattern, see Voice-of-customer reports from cross-channel feedback. For the pattern-detection mechanics across customer feedback, see Find patterns in customer feedback.
FAQ
What about customers who don't file support tickets and still churn?
The signal isn't there to detect, and that's a known limitation. Pair this support-signal pipeline with a composite health score (product usage decline, billing changes, CRM activity decline) to catch the quiet churners. Some accounts will always be hard to predict — external events, budget cuts, leadership changes — and the right response is fast retention motion when the cancellation hits, not over-investing in unpredictable prediction.
How do we avoid false positives that fatigue the CS team?
Calibrate the threshold conservatively in the first quarter — fewer flags, higher confidence per flag. As CS gains trust in the system, the threshold can loosen to capture more borderline cases. The bigger risk is the inverse — too many flags, CS tunes out, real risks get missed. Better to start strict and loosen with evidence than the reverse.
Can the AI write the outreach message to flagged customers?
Yes for the draft; humans for the send. The pipeline can draft a customer-success outreach email referencing the specific signals (in human-readable form, not "the AI flagged you for declining sentiment") and propose a meeting. CS reviews and personalises before sending. See sales follow-up sequences with CRM context for the broader generation pattern; this is the CS equivalent.
What about confidential ticket content — should it go through an LLM?
Use enterprise-tier APIs with data exclusion clauses, or self-host for very-sensitive industries. The extraction produces structured signals; design the pipeline to extract and discard rather than storing the conversation content. See AI privacy — what to watch for for the framework.
How is this different from sentiment analysis on support tickets?
Sentiment is one signal; the value is in combining sentiment trajectory with other signals (topic clustering, escalation rate, churn-language mentions, response patterns). Single-signal sentiment analysis flags too many accounts (negative sentiment is common in support contexts even for healthy customers) and misses the subtle non-sentiment indicators. The multi-signal composite is the lift over pure sentiment.